
Here we outline the stages to creating a custom data set via the Office for National Statistics website.
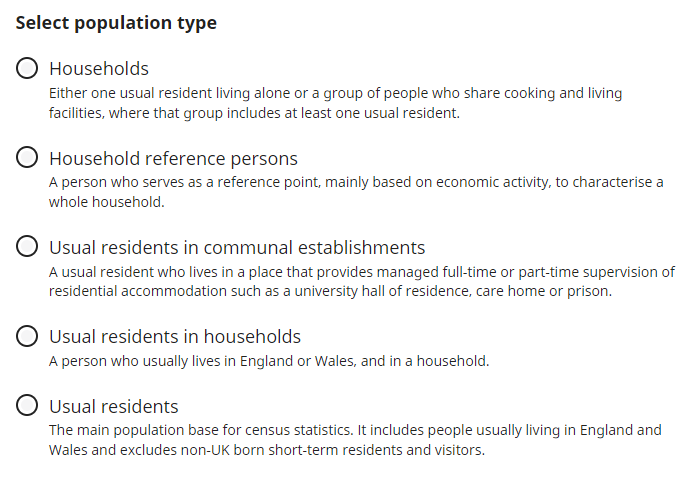
Step 1
Choose population type - likely to be Usual residents unless you are interested in household data such as housing tenure e.g. owner occupied or private rental.
Step 2
Choose the Area you are interested in.
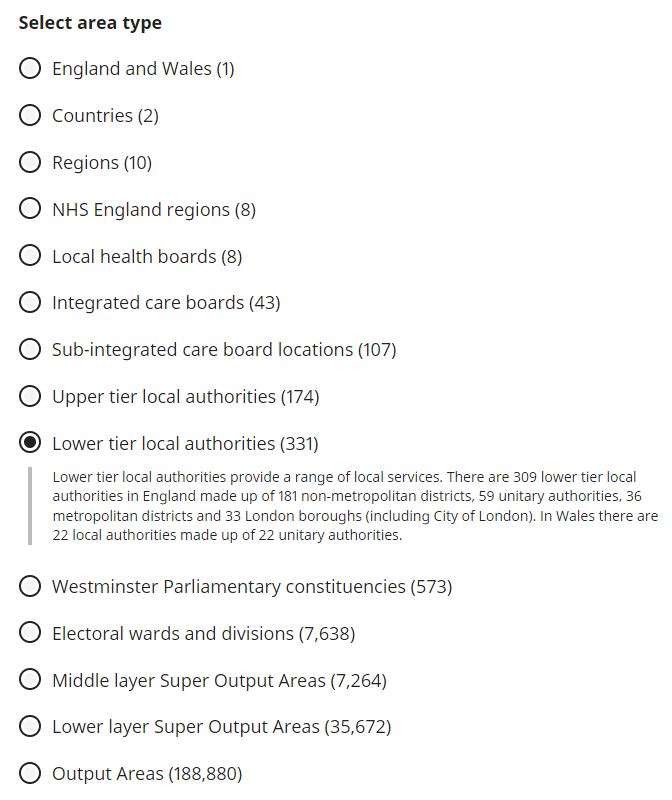
Note - when opting for higher levels of geography e.g. Regions or Local Authority areas, more detailed statistics can be produced. However, if a lower level of geography is used, such as Wards or Output areas (these have a minimum of 100 persons), the statistics produced have less detail. This is to protect the confidentiality of people and ensure that individuals or their characteristics cannot be identified.
Step 3
Choose the coverage of the data you'd like to look at.
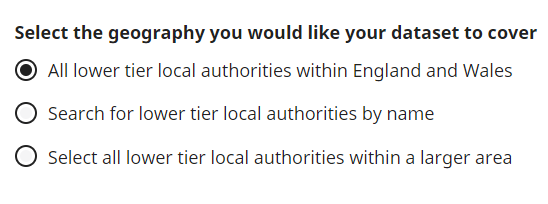
For London, Select Region in the Area type and then Enter London in the Select all lower tier local authorities within in a larger area Coverage option and select Add.
Step 4
Now add your Variables. Click to browse and you'll see there are 44 variables alphabetically listed as below. We'd suggest you start with two variables for simple and meaningful comparisons, too many could create an unmanageable dataset which is more tricky to analyse. Once you've selected a Variable, don't forget to click Add.
- Age
- Age of arrival in the UK
- Country of birth
- Country of birth extended
- Disability
- Distance travelled to work
- Economic activity status
- Economic activity status last week
- Employment history
- Ethnic group
- General health
- Highest level of qualification
- Hours worked
- Industry (current)
- Industry (former)
- Length of residence in the UK
- Living arrangements
- Main language
- Main language
- Marital and civil partnerships status
- Method used to travel to the workspace
- Migrant indicator
- Multiple passports held
- National Statistics Socio-economic Classification
- National identity
- National identity (detailed)
- Number of people aged 3 years and over who can speak welsh
- Occupation (current)
- Occupation (former)
- Passports held
- Place of work indicator
- Proficiency in English language
- Religion
- Second address indicator
- Sex
- UK armed forces veteran indicator
- Unpaid care
- Welsh language skills
- Welsh reading ability
- Welsh speaking ability
- Welsh speaking ability of dependent children
- Welsh understanding ability
- Welsh writing ability
- Year of arrival in the UK
Step 5
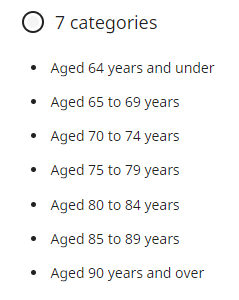
Choose you categories. You will be presented by a default category option, but you can Change this.
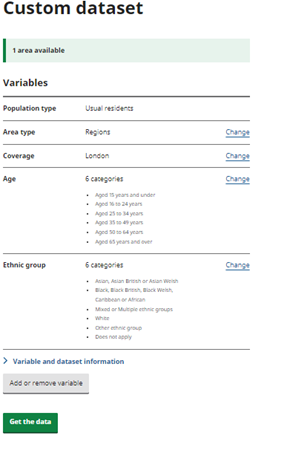
If for example you were particularly interested in older people, you could Change to another category option that a more granular breakdown in this older age range, as shown below. All in all there are over 30 different options for Age categories, so you are bound to find the one that suits best.
As another example - Ethnic group by default displays as 6 top level categories. But if you click on Change, you can choose another option with 20 different Ethnic groups.
Step 6
Choose Get the data and then select the XLSX format and Download.
Step 7
Analyse in Excel.
We'll be adding a range of resources and support opportunities here to help you create a Pivot Table and then visualise your data in a Pivot Chart.
- Join one of our monthly practical 60 min sessions to Create a custom data set and explore the data in Excel - check dates and book your space here
- Follow these step by step guides:
- Try our online Excel Bitesize Self Learn Series to learn new Excel skills including Pivot Tables
- Request a one to one session if you need additional support by emailing info@superhighways.org.uk
Contact

Datawise London is a partnership led by Superhighways at Kingston Voluntary Action.
If you are interested in finding out more about the project and its resources or would like to share your own data ideas and challenges please contact us.