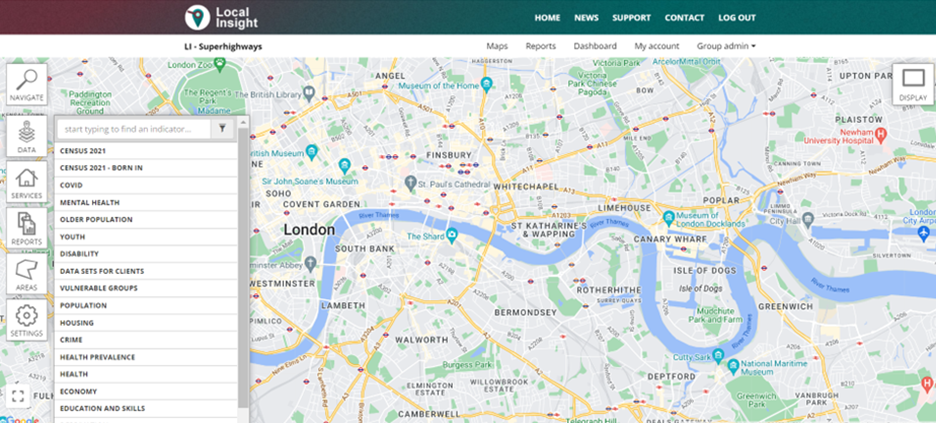
The Local Insight tool, designed and developed by OCSI (Oxford Consultants for Social Inclusion), enables us to look at open source data (including Census Data from 2011 and 2021) overlaid with geographical boundaries of your choice.
Local Insight contains data from more than 60 reputable data sources including Department for Work and Pensions, Office for National Statistics, Police UK, Land Registry and Hospital Episode Statistics. They use their expertise and networks to identify new sources of data, so the list is always growing.
Read more about Local Insight here.
You can explore data by selecting a data indicator organised in a range of category options.
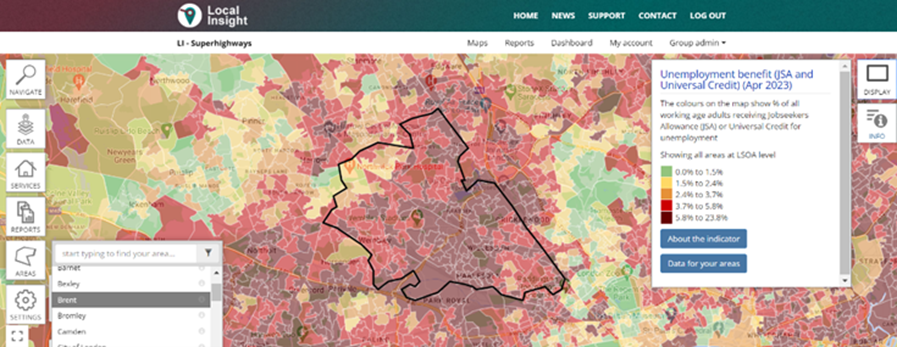
Then explore an indicator overlaid by your choice of geographical boundaries, including at borough level.
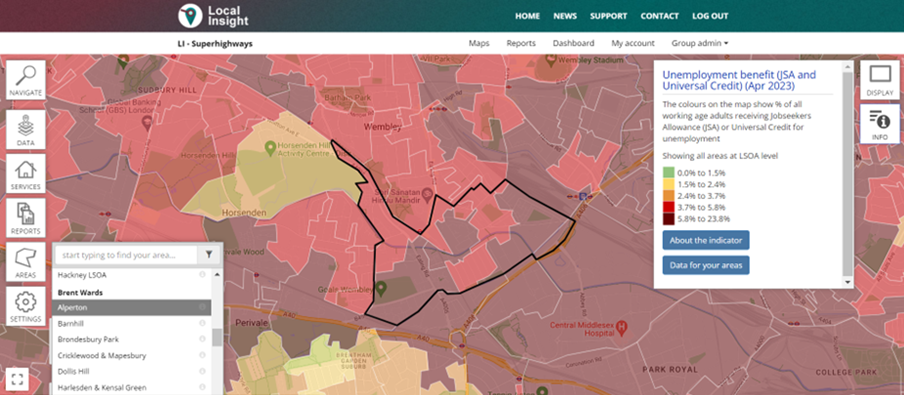
Some indicators are available at Ward level too.
For many indicators, data is available at smaller geographies - the maps here show the Lower Super Output Area boundaries. You can hover over each of these and see the name and data value for each.
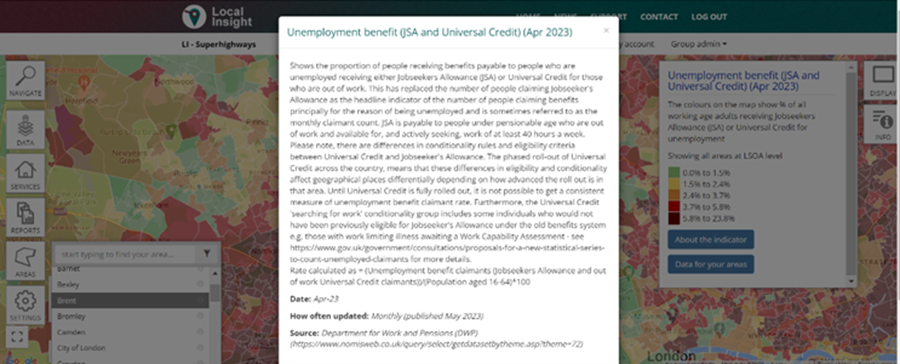
You can click on ‘About the indicator’ to get specific information about the source of the data and importantly, the published date.
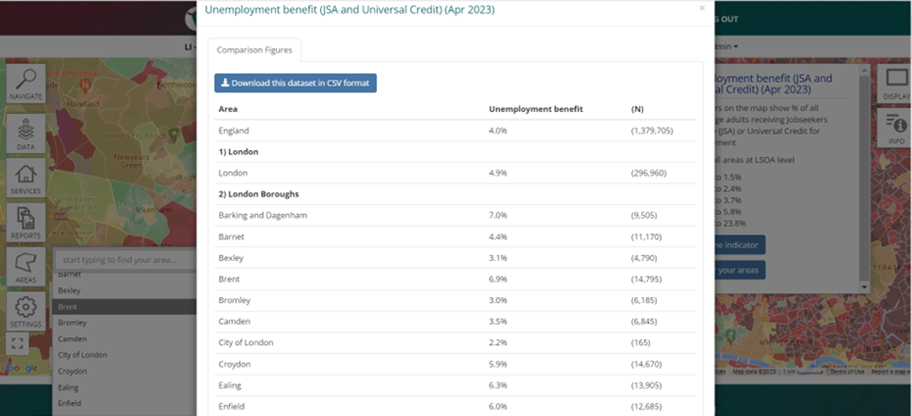
You can see the data for your chosen geographical area compared to England, London-wide and other boroughs in a downloadable table format.
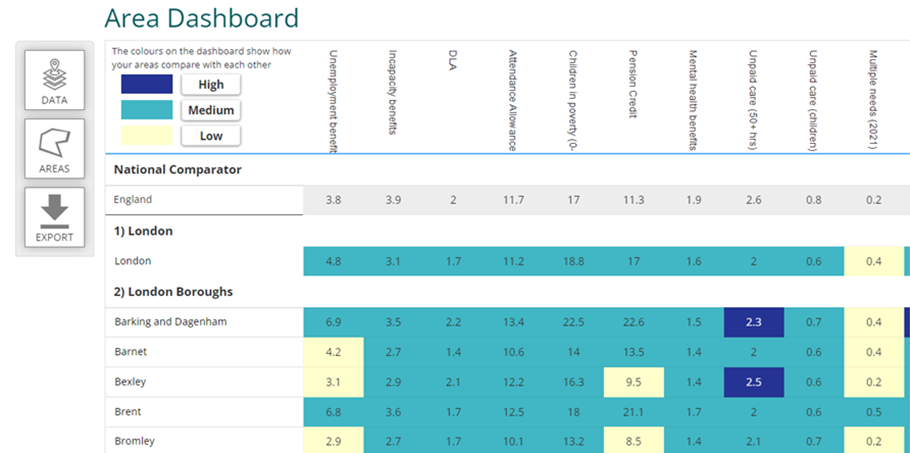
Or you can create a Dashboard and see your data compared using colours to demonstrate high, medium and low.
Superhighways has a subscription for the Local Insight platform and can arrange a one-to-one with small charities and community organisations working in London, to look at these data indicators relating to a geography of your choice.
Please fill in this short form to arrange a one-to-one with us, giving as much information as possible about what you would like to explore and at what geographies, to give us some time to prepare in advance.
Contact

Datawise London is a partnership led by Superhighways at Kingston Voluntary Action.
If you are interested in finding out more about the project and its resources or would like to share your own data ideas and challenges please contact us.
