Guest blogger Lucy Smith, Social Research and Data Lead at London Plus, shows us how (with a little help from Datawise London partners and friends) she created a Lava Lamp Plot showing levels of deprivation and political control in London's boroughs using R.
And how you can also get started with R.
(We at Superhighways had spotted Open Data Manchester's Lava Lamp Plots visualising deprivation data against political control, and so when we heard that our London Plus colleague Lucy had recently attended R training, our challenge to her was to recreate these, just showing the London boroughs so we could use as a resource in our Datawise London training. Here's how she did it...)
First things first - what is R?!
R is an open source computer programming language which is highly popular amongst data professionals working within the charitable sector.
Being open source in nature, R is completely free to download and use- and it’s features and functions are continuously being revised, adapted and improved by the community of data scientists around it.
R is commonly used in two forms. Base R is the programming language underpinning the more popular RStudio.
To the naked eye, base R is not particularly appealing. It’s clunky and a little bit tricky to use - making it a hit with hardened data scientists and programming veterans, but not so much with intermediate users or beginners.
RStudio is the most popular version of R used by data scientists and charitable organisations. RStudio runs on Base R, but the user interface has been “cleaned up” and adapted to be accessible and user friendly.
Because of this, RStudio has been designed to look more like software package you might use in your daily role.
It has built in features to let you know when you’ve made a mistake and is also equipped with a troubleshooting centre, making it an ideal place for beginners to get started with the basics of coding.
You can see what RStudio looks like here.
How did we write our code for London boroughs?
Back in July, I had the pleasure of attending a free ‘Pick n’ Mix’ session for R users facilitated by Open Data Manchester.
The session was delivered by director Jamie Whyte and covered the basics of data wrangling with R and visualization with ggplot2, alongside a mini dive into the English Indices of Deprivation and a customised dataset which explored political control at the Local Authority level across England.
Using a GitHub repository, Jamie talked us through the data and his code before we then had the opportunity to generate plots of our own in RStudio. (if you’re interested in learning more, I highly recommend watching a recording of the session here!).
The code Jamie had initially provided us with covered the north of England.
This meant that I had to amend the code for a London based search.
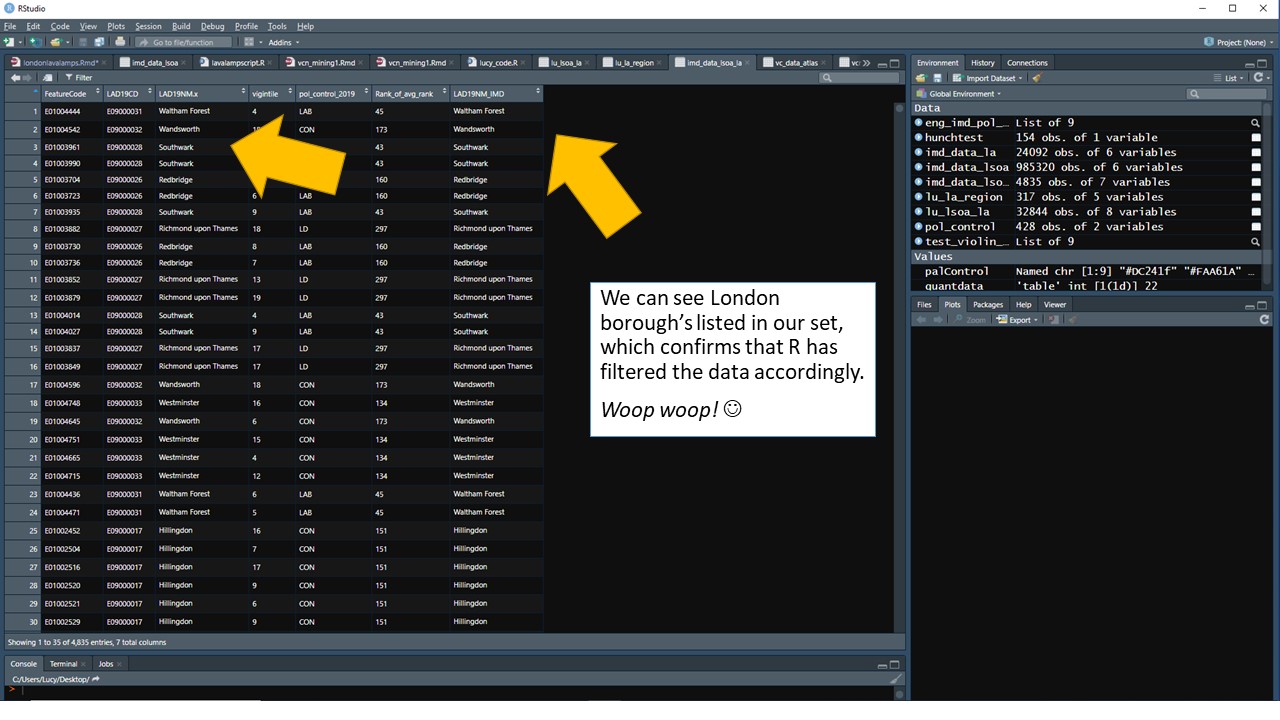
I did this by instructing R to filter both datasets (Indices of Deprivation and Political Control) for London boroughs. Once I’d done this, I was then able to use Jamie’s code template to generate a lava lamp plot for London. However, this didn’t turn out quite as planned at first…
Mistakes like this are very common in R and are not worth stressing about!
The best thing to do when things go wrong is to review your code step-by-step, instruction by instruction.
After checking my data, I knew that my instructions asking R to filter for London were correct. This meant there were bugs in the visualisation instructions, rather than my data handling, that I needed to fix. Phew!
Luckily, the incredibly talented Dulcie Vousden from DataKind UK was on hand to help me out.
Since I’m new to R (I only started learning in February), I asked Dulcie, an expert, whether she able to identify where I had gone wrong.
It turned out that I had made the simple mistake of forgetting to amend the parameters in my visualisation instructions.
This meant that R was trying to squash too much content into one space because I had given it measurements that were too small.
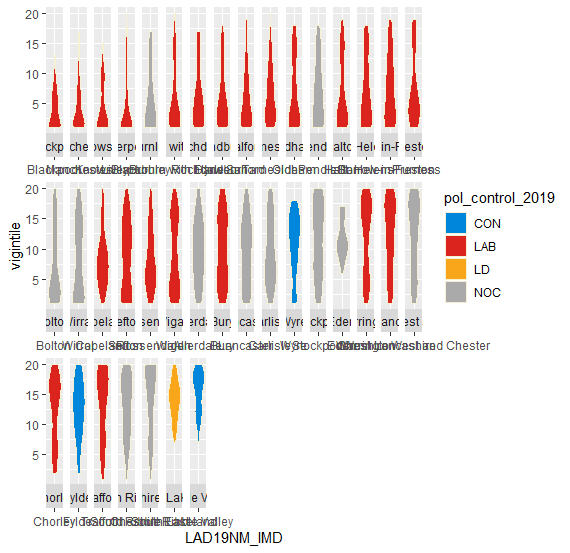
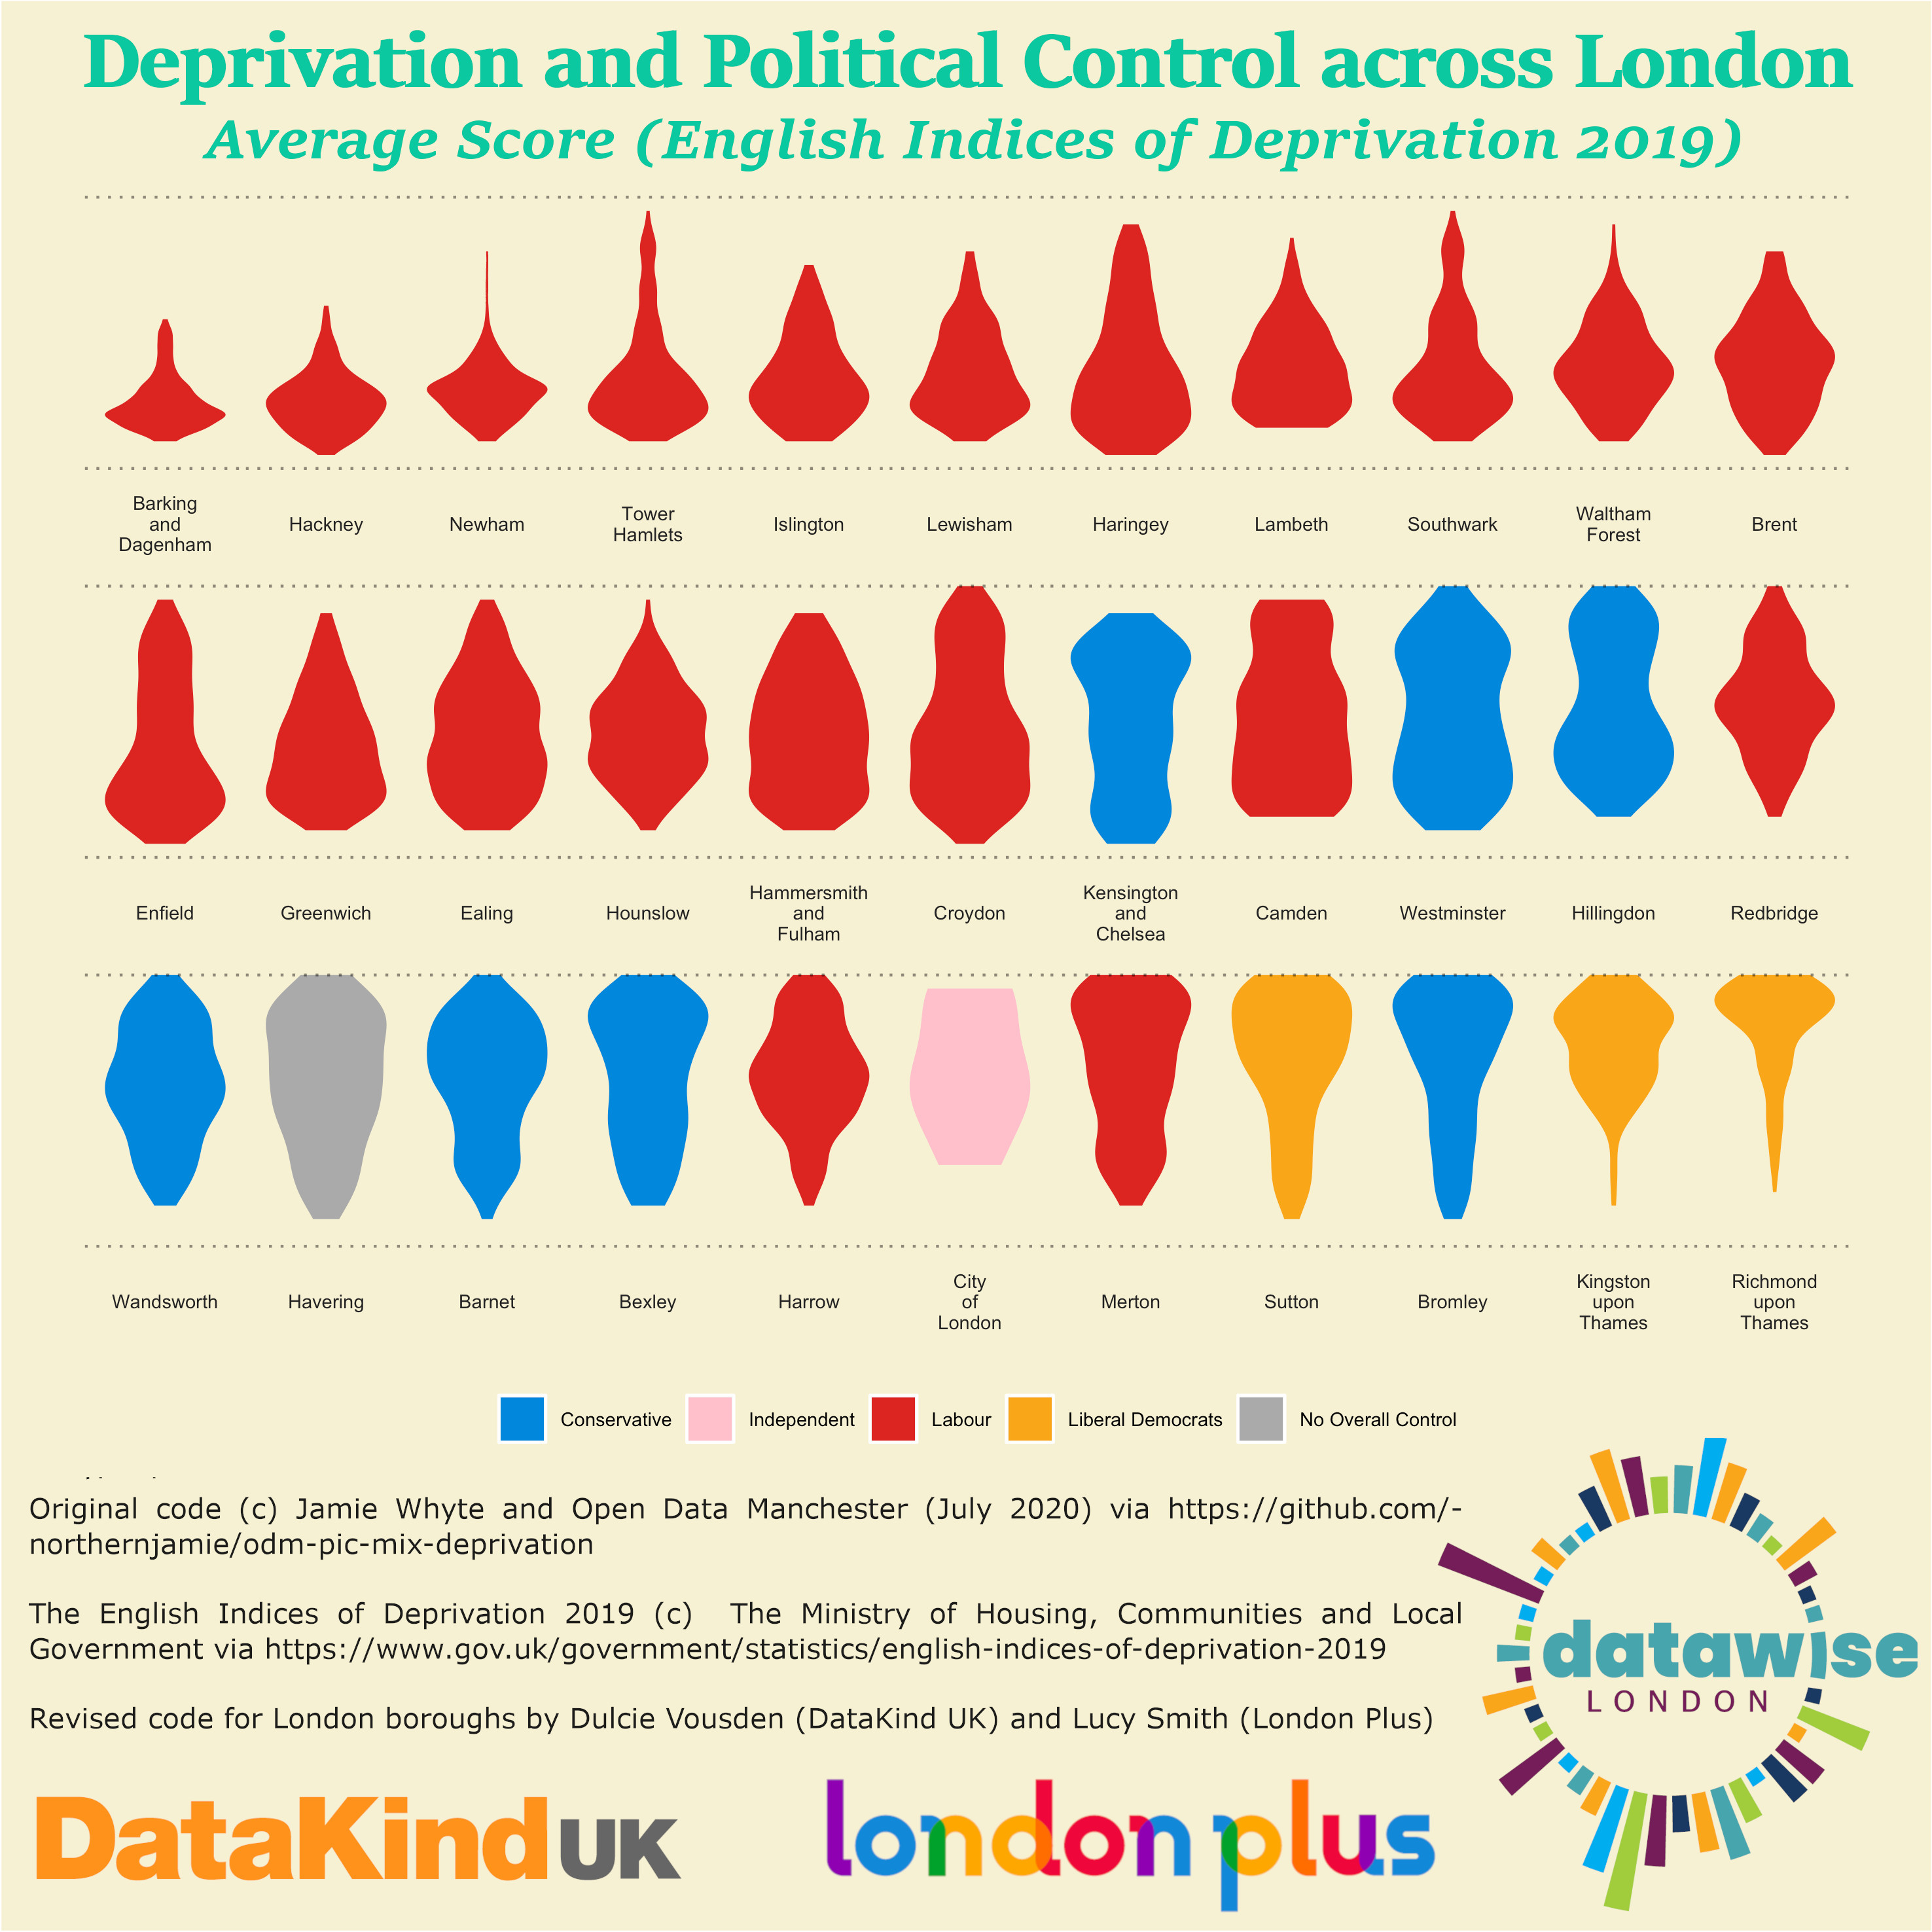
Dulcie amended this by changing the parameters, and also wrote down an instruction to make sure there was space at the bottom to add in any credits. The output then looked like this:
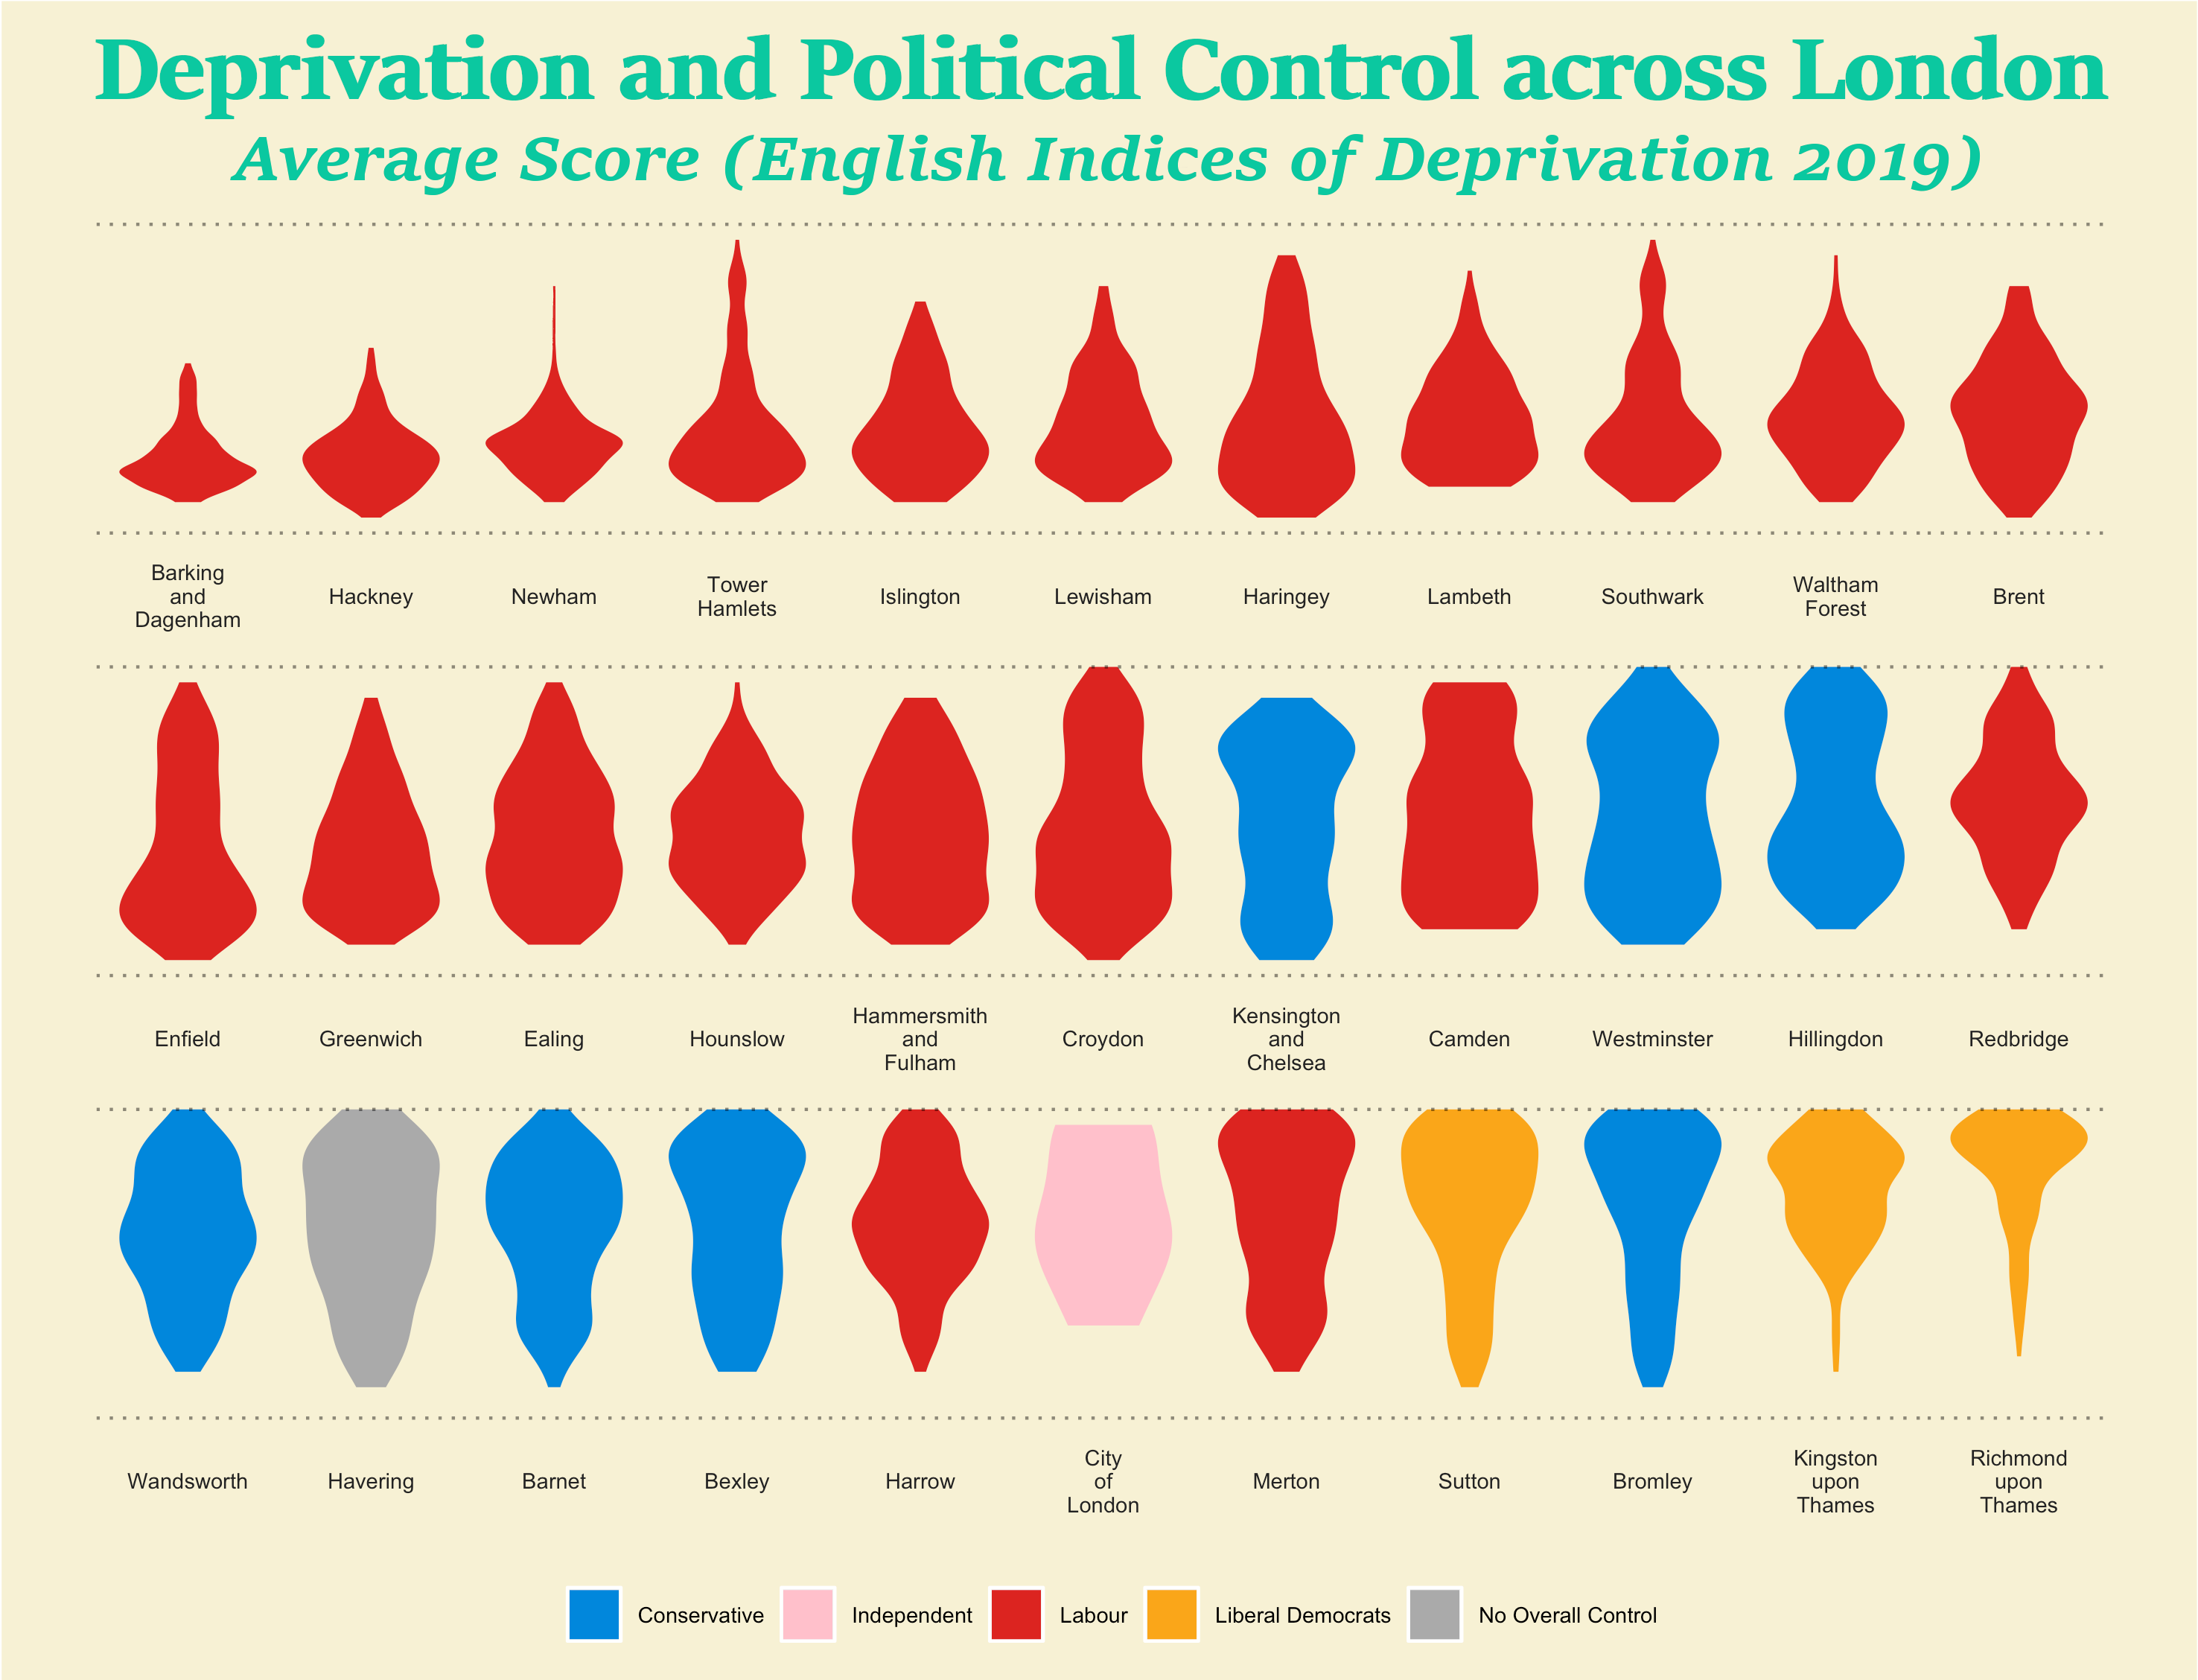
In case you haven't worked it out, the visualisation shows deprivation data with 'lava lamps' that are wider at the top representing low deprivation and those with wider bases, representing higher proportions of higher deprivation. The different shapes result from the distribution of deprivation for each council area. The colours represent local authority political control - see key below.
Success! A blank canvas to work with. I saved my file as an image and exported it to Gimp (basically a free photoshop, check it out!) to add in my titles, credits and our logos. And here’s the final product!
It’s really as simple as that.
Apart from the hiccup, doing the whole thing took me less than an hour and now, thanks to Open Data Manchester and Datakind UK, we have a fantastic infographic of our own to share.
If you’re interested in finding out more about R and how to get started, read on!
Is R for me? A brief overview of the pros and cons…
As an open source programming language, R has many benefits for charitable organisations.
Here's a brief overview of the pros and cons associated with R for your organisation to decide whether learning R could be right for you.
Pros
- R and all of it’s packages are completely free to use, forever!
- R has a suit of packages known as the ‘Tidyverse’ tools which have been designed to make the data handling process quicker and easier for the user
- R’s packages and tools are continuously being adapted, updated and new content created
- There are lots of free training resources and guide available online for R.
- Most file types are compatible with R. CSV files can be read into R, as can Microsoft word, PDF and .txt files.
- R has a friendly, global community. The R Community have free forums you can sign up too, as well as local meet ups. The community is also involved in advocating for ethical issues within data science, and has special events for Women and minority groups trying to break into the sector.
Cons
- R uses code so there isn’t a user interface per se. Excel, for example, has ribbons and buttons making it easier to navigate. In R, these features don’t exist- instead, you need to write your instructions (code) directly into the computer. This means that you will need to learn the basics of the language before you can use the software properly.
- R is a language and, like French or German, there are no “quick fixes” for learning. Making time to practice what you’re learning is essential i.e use it or lose it!
- R can get complicated quite quickly- so expectation management is key. R is great for things like graphics and visualisations, but a more complex query like processing a particular type of data may require advanced code- and this may require additional capacity. Depending on what you want to achieve with R, you may have to attend additional training or consult an expert to make sure you’re getting the outputs you want.
How can I get started with R?
If you’re looking to get started with R, knowing how and where to begin can be very confusing and overwhelming. Luckily, Datawise London has got you covered!
I’d recommend first and foremost booking submitting a data challenge to discuss your options.
Think about any data challenges or objectives you’d like to achieve - nothing too complex, aim for an easy win.
Learning R around a basic project is a really great way to get started without getting lost in the details. A basic project could be something along the lines of:
Visualisations. Visualising some numerical data you have i.e characteristics of beneficiaries, number and variety of provisions delivered in a year.
R has a fantastic visualisation suite called ggplot2 which can help you create an array of different graphs and charts to showcase your data.
Text analysis. Do you have a lot of pieces of text you need to analyse? Maybe you’ve recently conducted a survey and you’re not sure about how to summarise the responses.
R has an array of text visualisation tools you can use, making this a great way to get started!
Data Wrangling. Do you have a really big data set that you need to tidy up?
R has a lot of built in features and short cuts that Excel doesn’t, making it a handy tool for tidying up your data without having to go through each entry manually!
Resources to learn R
As mentioned earlier, there are loads of training resources to help you get started with R.
For starters, there are free versions of O’Reilly textbooks for R online such as R for Data Science.
Websites such as DataCarpentry.org, GitHub and Stack Overflow also have lots of free resources. However, many of these are not interactive and may therefore be initially challenging for beginners.
DataCamp, CodeAcademy, Coursera, LinkedIn Learning and many others offer free introductions to R. But be aware that these are subscription based services, so not all of the courses are free, and you might get caught out paying for access if you don’t cancel the free trial in time.
If you didn’t fancy signing up for anything, there are lots of short tutorials available on YouTube. Similarly, platforms such as Vimeo and Twitch have recordings of training sessions - as well as free livestream training sessions, from time to time!
There are also lots of R Slack channels available.
Get advice or support to create your own Lava Lamps
You can ask us at Datawise London for help by submitting a data challenge.
Or connect with DataKind UK one of our Datawise London partner who specialise in providing expert advice to the sector and host free office hours for charities with pro bono data scientist volunteers. If you’re looking to get started with R, subscribe to their newsletter and sign up to office hours here.
DataKind UK also run a Social Data Society for data handlers and analysts working within the charitable sector. I’d recommend signing up to this, too. The society is a great way to get started, to meet other users of different skill levels, and to hear about how other people working with data are using software to solve problems. Also, they’re a super friendly bunch too! : - )
Downloading R
To download R and RStudio, please follow the guide closely.
Guide: https://rstudio-education.github.io/hopr/starting.html
Main R Website: https://www.r-project.org/
RStudio Main Website : https://rstudio.com/
Contact
Datawise London is a partnership led by Superhighways at Kingston Voluntary Action.
If you are interested in finding out more about the project and its resources or would like to share your own data ideas and challenges please contact us.