Executive summary
From September 2021 to May 2023 Superhighways and Think Social Tech set out to answer the question ‘how might we better support small charities and community organisations to move forwards with data?’
We undertook qualitative research with 36 small charities and community organisations to understand when key challenges emerge and where additional support or collective intervention could help.
The Small Charity Data Journeys research report outlines and presents a visual map of a typical data journey experienced by small charities and community organisations, highlighting:
Pathways: Distinct entry points and goals for moving forwards with data
Swamps: The key challenges and areas of data work where they get stuck
Bridges: Key factors which help to avoid or move on from swamps, making the journey easier
It intends to support all those involved within and around small charities and community organisations, directly and indirectly, to reflect on their role in their data journeys and how they might help.
It also includes a set of stories to showcase how data is helping to shape and improve local services, advocate for policy change, give voice to specific marginalised communities and access funding to respond to emerging needs locally.
Key learning about data journeys for small charities and community organisations
- Capacity is a key barrier, particularly for very small groups
- Data journeys often involve one step forward and two steps back
- Funders and funding affects data journeys. For better and for worse
- Data journeys need time, but this can be better spent
- Data is about numbers and stories. It needs to be used responsibly and equitably
Small charity data journey map visual and table
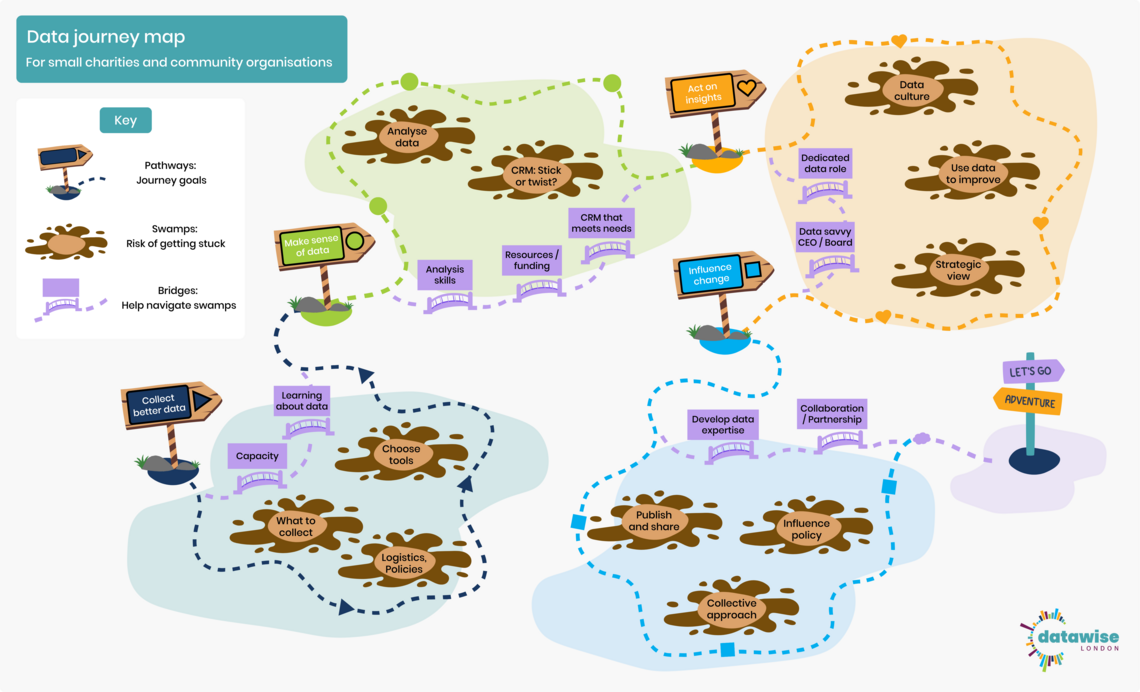
Pathways, swamps and bridges
Goal: Collect better data
Swamp: Deciding what to collect. It was hard to know where to start. There was a lot to learn about different data collection approaches. Few fully planned their data collection and analysis framework upfront. It was common to collect too much or regret what questions were asked (or not).
Swamp: Logistics and policies. Data collection often required new devices, hardware and additional office space or time at a desk. Policies needed to be in place for data protection, safeguarding and security. It took time to weigh up how to collect data in sensitive and appropriate ways to strengthen relationships.
Swamp: Choosing tools. Choosing tools was tricky with a limited budget. Whilst free tools were invaluable, they often come with some limitations. Learning how to use them and understanding limitations took time.
Bridges: Capacity (time for data work, budget, accessing free tools) and learning about data.
Goal: Make sense of data
Swamp: Data analysis. Most relied on spreadsheets and needed to use advanced functions such as formulas and pivot tables for analysis. Few had tools or skills to work with qualitative data and many struggled to find or work with secondary and sector data. Web based data and using AI look to be skills gaps.
Swamp: CRM: Stick or twist? Analysing data often highlighted the potential need for a new CRM. Spreadsheets became unwieldy, or current CRMs had poor reporting functionality. This was a difficult and potentially costly decision. Many got stuck understanding internal needs and what options would work best.
Bridges: Analysis skills, a CRM that meets their needs and resources or funding.
Goal: Act on insights
Swamp: A data culture. The person leading on data needed to get everyone on board, by upskilling teams, ironing out data collection problems and demonstrating how data is used.
Swamp: A strategic view. Overall, Board members and CEO’s needed a clear vision about their ambitions for data and how they would invest in this. They may need to upskill themselves and bring others on this journey.
Swamp: Using data to improve. It took concerted effort to transition from solely reporting on data, to presenting this in a way that would highlight trends and opportunities to change and improve.
Bridges: A dedicated data role and a data savvy CEO / Board were vital to moving forwards.
Goal: Influence change
Swamp: Publish and share. This needed confidence in what to say and how, editing and design skills. Further efforts or skills were also needed to share and promote this externally, both online and in person.
Swamp: Collective approach. A handful of organisations were sharing their data or systems, in order to strengthen their delivery, influencing work or benefit the sector. A significant investment of resources, expertise and time was needed to create data sharing agreements, align processes and develop shared infrastructure.
Swamp: Influence policy. Those hoping to achieve this needed confidence in their data to feed into relevant consultations. They drew on their experience of participating in local forums to shape their data collection.
Bridges: Developing data expertise internally and collaboration / partnership helped navigate these swamps.
End points?
For many, data journeys were circular and iterative. It was common to revisit earlier decisions. The goal was to continue building confidence in their data collection, analysis, action or influencing work around this.
Building better bridges
Whilst many small charities and community organisations are able to access funding and support to help them on their data journey, they continue to encounter the same challenges.
There is a clear need to build on current support and funding collectively, as well as individually, to meet key needs in the sector. The following calls to action are intended to help provoke reflection and action:
How might we…
- Create capacity and headspace to plan data collection and analysis?
- Better support equitable and responsible approaches to data collection?
- Improve the use of spreadsheets, qualitative data and secondary data in the sector?
- Improve decision making, use and ownership of CRMs in the sector?
- Better design funding to support good data journeys?
- Enable CEOs and board members to develop data literacy and approach data strategically?
- Encourage small charities to prioritise sharing their data and insights?
- Celebrate and share good data practice to inspire others?
Contact us and download the report
If you would like to talk to us about the research or get involved in answering the 'How might we?' questions please email Superhighways.
Data journeys launch and workshops
Contact
Datawise London is a partnership led by Superhighways at Kingston Voluntary Action.
If you are interested in finding out more about the project and its resources or would like to share your own data ideas and challenges please contact us.